
Graphic Historical Fisheries Data Available at Northeast Science
Center Website
The Northeast Science Center in Woods Hole, MA has fisheries data collected over decades in graphic form on their website. It includes a video presentation of historical lobster data from 1968 to 2008. There are graphs and charts on several species that describe changes in abundance, population concentrations around the Gulf of Maine, landings and many others.
These graphs are from the site. There is also a two-minute video presentation of lobster population and location changes from 1968 to 2008. www.nefsc.noaa.gov/ecosys/climate_change/historical.htm
Temperature and lobster phenology from the Gulf of Maine
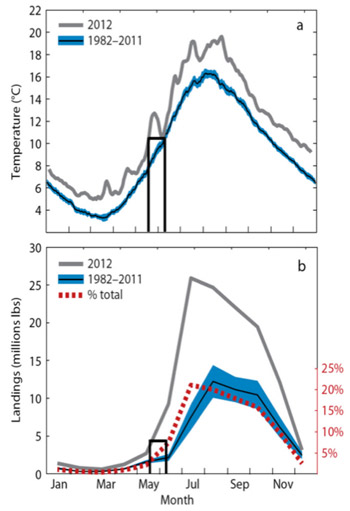
Reproduced from Mills et al. (2013) with permission.
(a) Gulf of Maine SST in 2012 (gray) referenced to the 1982–2011 climatology (darker region is +/– 2SE). The black bar centered at day 150 is 22 days wide, the mean shift in the temperature phenology.
(b) Maine lobster landings for 2012 (gray) and the 1992–2011 climatology (darker, +/– 2SE ). The dotted line is the 2012 landings expressed as a percentage of the total. The black bar is the same as in (a). The 22-day shift reported for SST is similar to the shift in both the total and percentage of landings.