
Lobster Catch-to-Trap Ratio Studied
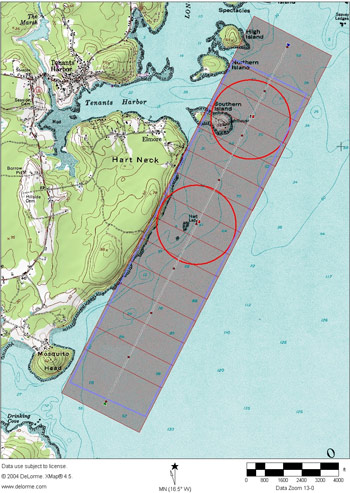
Weekly aerial overflights were employed to pinpoint, count, and map every single buoy in the study and control areas. The count showed that there were 11,183 buoys in the combined control and study areas of 3.6 square nautical miles. Of those, a bit more than 3,000 buoys were in the two study areas. Courtesy of Carl Wilson
If lobsters amble so many feet in a day and the aroma of bait wafts in a radius of an average given distance, how many traps does each lobster get to choose from for its dining pleasure – and, of course, for the dining pleasure of its human predators.
It sounds like a dreaded fifth-grade algebra problem. But the intersection of lobsters as they perambulate the ocean bottom with “bait plumes” that emanate from traps have yielded two new concepts in lobster research – “trappable area” and “neighboring traps” – that might help researchers and fishermen determine an optimum trap density.
An optimum trap density, said Department of Marine Resources biologist Carl Wilson, might be a number of traps that is fewer than those that now populate the Maine coast, but still maintain high catch rates.
About 60 fishermen heard a report from Wilson regarding a trap density survey he conducted last summer off Tenants Harbor. Wilson offered his report during the Maine Fishermen’s Forum.
His findings about trappable areas and neighboring traps were the secondary results of his original research project last summer, which was to find out more about how trap density impacts catch rates in a heavily fished area. The project was initiated to find out whether fishermen might be able to reduce the number of traps they set and still catch the same amount of lobsters. The research comes about at a time when Maine’s lobster industry and the fishery’s managers are pursuing discussions on reducing fishing effort.
Wilson issued an invitation two years ago to towns to participate in a collaborative trap density study. Only one town, Tenants Harbor, responded.
“I’d like to emphasize how important it is for a community to step forward and engage in a very difficult conversation,” he said. “Last year, 2009, was a very difficult year for the lobster fishery in terms of prices, and there was just a lot of anxiety. It was the first year of everyone having to fish sinkline.”
Of the 90 licensed fishermen in Tenants Harbor, 35 fishermen participated.
The idea, said Wilson, was to remove 30 percent of the traps from two small experimental areas, each half a square nautical mile. Catch would be sampled before, during, and after trap removal. The study areas were bounded by a long swath of water that was the control area.
Weekly aerial overflights were employed to pinpoint, count, and map every single buoy in the study and control areas. The count showed that there were 11,183 buoys in the combined control and study areas of 3.6 square nautical miles. Of those, a bit more than 3,000 buoys were in the two study areas.
“That’s a lot of gear, there’s no doubt about it,” said Wilson. “But, this is what we wanted to do with the experiment, was go into the dragon’s mouth and try the experiment at the worst [highest density] possible time of year.”
High-density trapping is typical along the Maine coast, he noted. Of the 35 fishermen who had gear in the study areas, 13 moved more than 1,000 traps. They were compensated for the effort. The traps were not taken out of the water altogether. They were relocated outside of the control and study areas.
“The concept of the experiment was that we’d take the two experimental areas, reduce the number of traps and look at what the catch rates were,” said Wilson.
In addition to the aerial overflights, researchers conducted 24 sea sampling trips on 13 different boats from one port over the course of a month. They measured more than 5,000 trap hauls and almost 24,000 lobsters. Every lobster – more than 2,000 – encountered in the experimental areas was tagged.
In the end, this particular angle of the experiment proved fruitless due to an unpredicted circumstance. It turned out that lobster fishermen with traps in the control area had moved a similar percentage of traps because they were following the lobsters as the crustaceans made their usual pilgrimage further offshore. Thus, there was no difference in catch rates between the study and the control areas, Wilson said.
However, he said, the use of aerial photography to count buoys proved unexpectedly fruitful when he began to examine the experiment from other angles. This was the first time the industry’s shifting mass of traps has been caught on camera over any period of time, and this enabled researchers to study two new concepts for understanding the interaction between fishermen and their prey – “trappable area” and “neighboring traps.”
The trappable area, said Wilson, represents the area that’s reached by a trap’s bait plume, which is the area of attraction to a lobster. Wilson cited information from University of New Hampshire marine researcher Win Watson who, through underwater video and sonic tagging research, found that each trap has a radius of about 90 feet that comprises the trappable area.
Applying that information to the trap densities revealed by his study’s photographs, Wilson said, he found that every trap had trappable areas that overlapped with numerous other traps, sometimes as many as 30. Whereas the optimum distance between two traps would be 180 feet, given that each trap’s trappable area was 90 feet, the average distance between traps in the photographed area was 58 feet. In the study areas, 50 percent of the traps had a minimum of 30 neighboring traps within each trappable area.
A possible conclusion, he said, is that there might be some advantage to reducing the competition by reducing the number of traps in an area.
Wilson said it might be worth it for fishermen to take a look at what happens if they reduce density. He offered examples of lower trap density elsewhere along the Maine coast as possible target figures. The Tenants Harbor swath of 3.6 square nautical miles has 11,000 traps for a trap density of about 3,000 traps per square nautical mile. The Monhegan Island conservation area of about 28 snm has about 3,600 traps all together, for a density per mile of 130 traps. The Swans Island conservation area, also about 28 snm, has about 33,000 traps for a density of 1,200 traps per mile.
If fishermen in the 3.6-snm area at Tenants Harbor were to apply the same density as Swans Island, the Tenants Harbor area’s density would be about 4,000 traps all together, down from 11,000. If the Monhegan Island density were applied, there would be about 500 traps in the 3.6-snm area at Tenants Harbor.
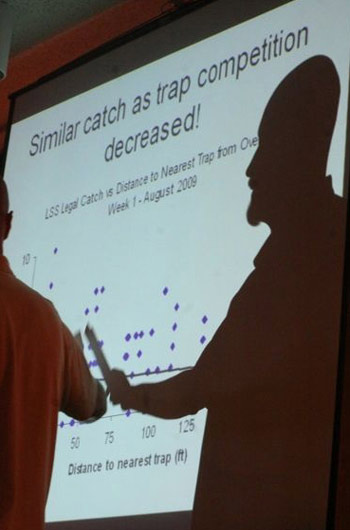
Carl Wilson said he found that every trap had trappable areas that overlapped with numerous other traps, sometimes as many as 30. Whereas the optimum distance between two traps would be 180 feet, given that each trap’s trappable area was 90 feet, the average distance between traps in the photographed area was 58 feet. Laurie Schreiber Photo
Whether fishermen would be willing to reduce their trap numbers, even given reasonable assurance that the reduction would not affect their catch rate, is another question entirely, Wilson said.
“As a state, when we talk about trap density, this experiment has given us a lot of insight into how people might react to change and it’s not necessarily a cut and dried situation,” he said. “This was not an easy project. And trying to fit science into 35 very independent fishermen’s hauling schedules. We were calling too much, so people may have stopped answering.”
Wilson said he’d like to get more Tenants Harbor fishermen involved in the next phase of the experiment, which would involve a larger area for a longer amount of time, and the removal of more traps. Conversations at this point are very preliminary, he said, and it is not expected that the next phase will be pulled off this summer.
Fishermen also learned about the next phase of the DMR’s ventless trap program, which was initiated in 2006 and continues as a long-term monitoring program during the months of June, July and August.
The survey randomly deploys ventless traps designed to generate estimates of lobster abundance and recruitment. Abundance can’t be measured by catch rates, because lobstermen fish their gear in locations where lobsters are known to congregate in order to maintain optimal catch rates.
The survey samples the lobster population from Maine through New York, and the overall sampling effort has been divided into two regions: the Gulf of Maine and southern New England. The DMR contracts with fishermen to cover nine sampling legs from the Canadian border to the New Hampshire border.
Wilson said one of the goals of the state and region’s various lobster studies is to bring information together to incorporate into the lobster stock assessment process.
“The idea is that you can string these indices together to have a forecasting tool,” said Wilson.